The following myKillik features and enhancements were released today:
- Research page
- Investment page
- Watchlists page
- Advised View
- European Pricing Graphs
Research Page:
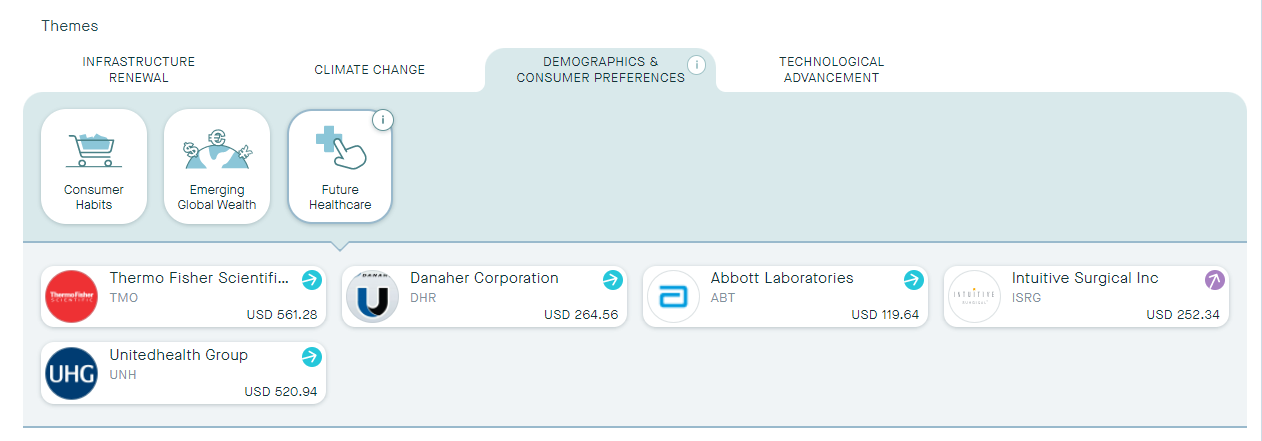
We have updated our Research page to display Themes more effectively. You can now find Equities through our four new Mega trends, which then breakdown into Themes. Under the individual themes you can find the stocks associated to the idea.
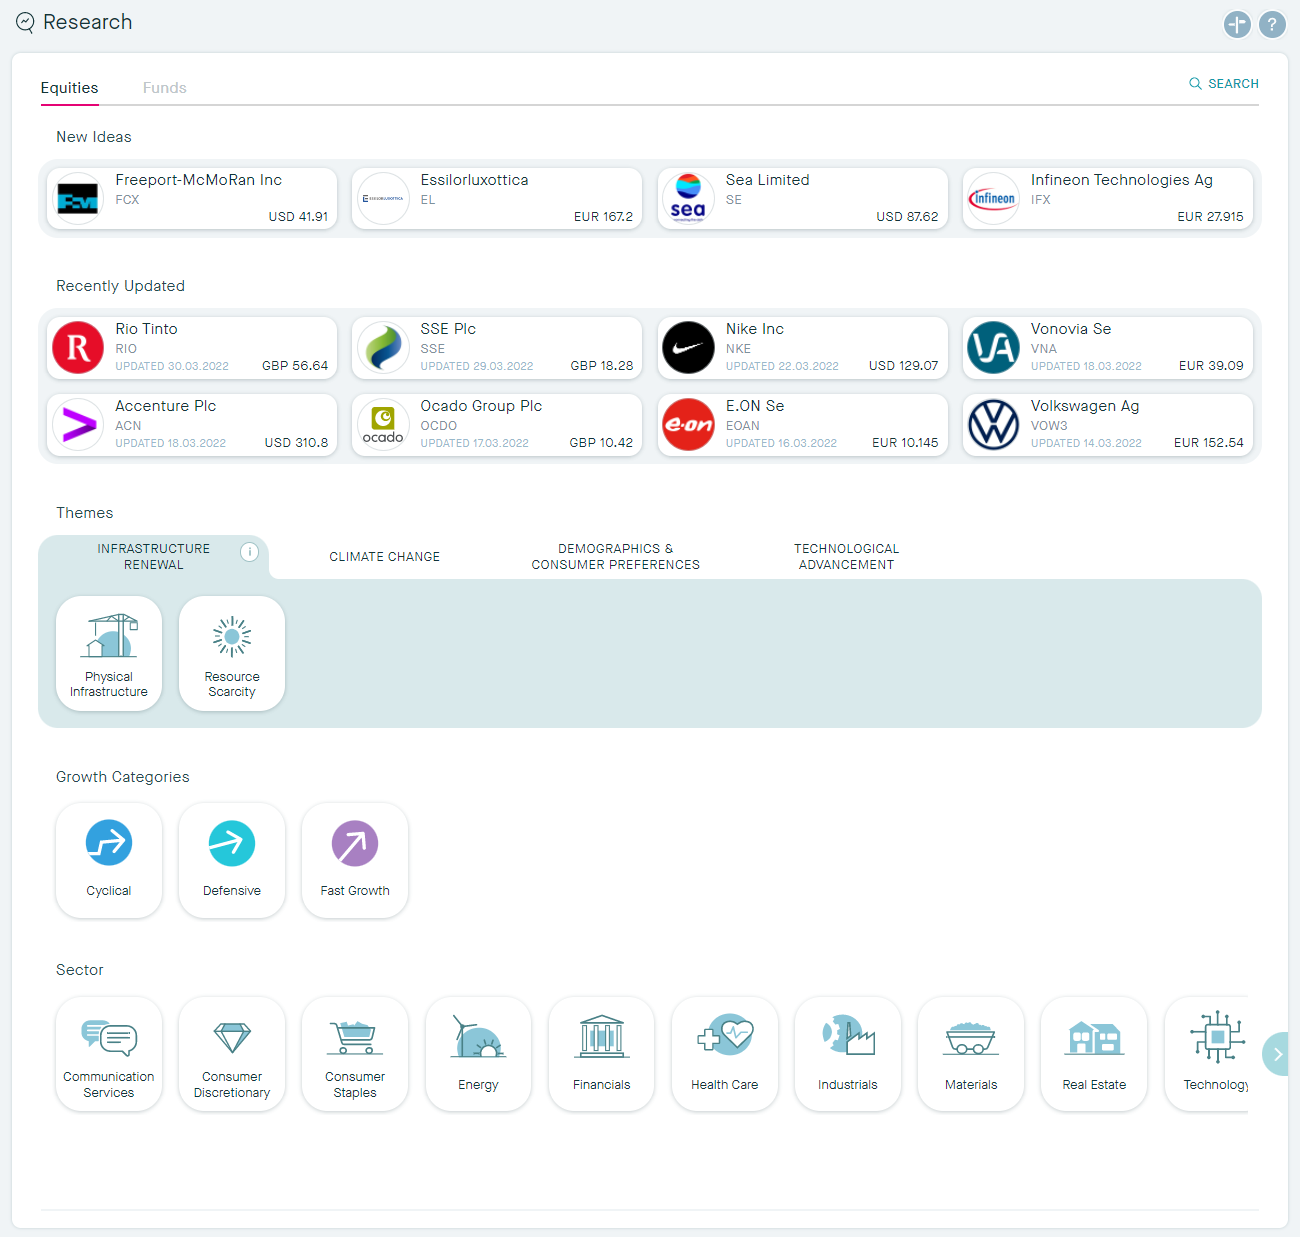
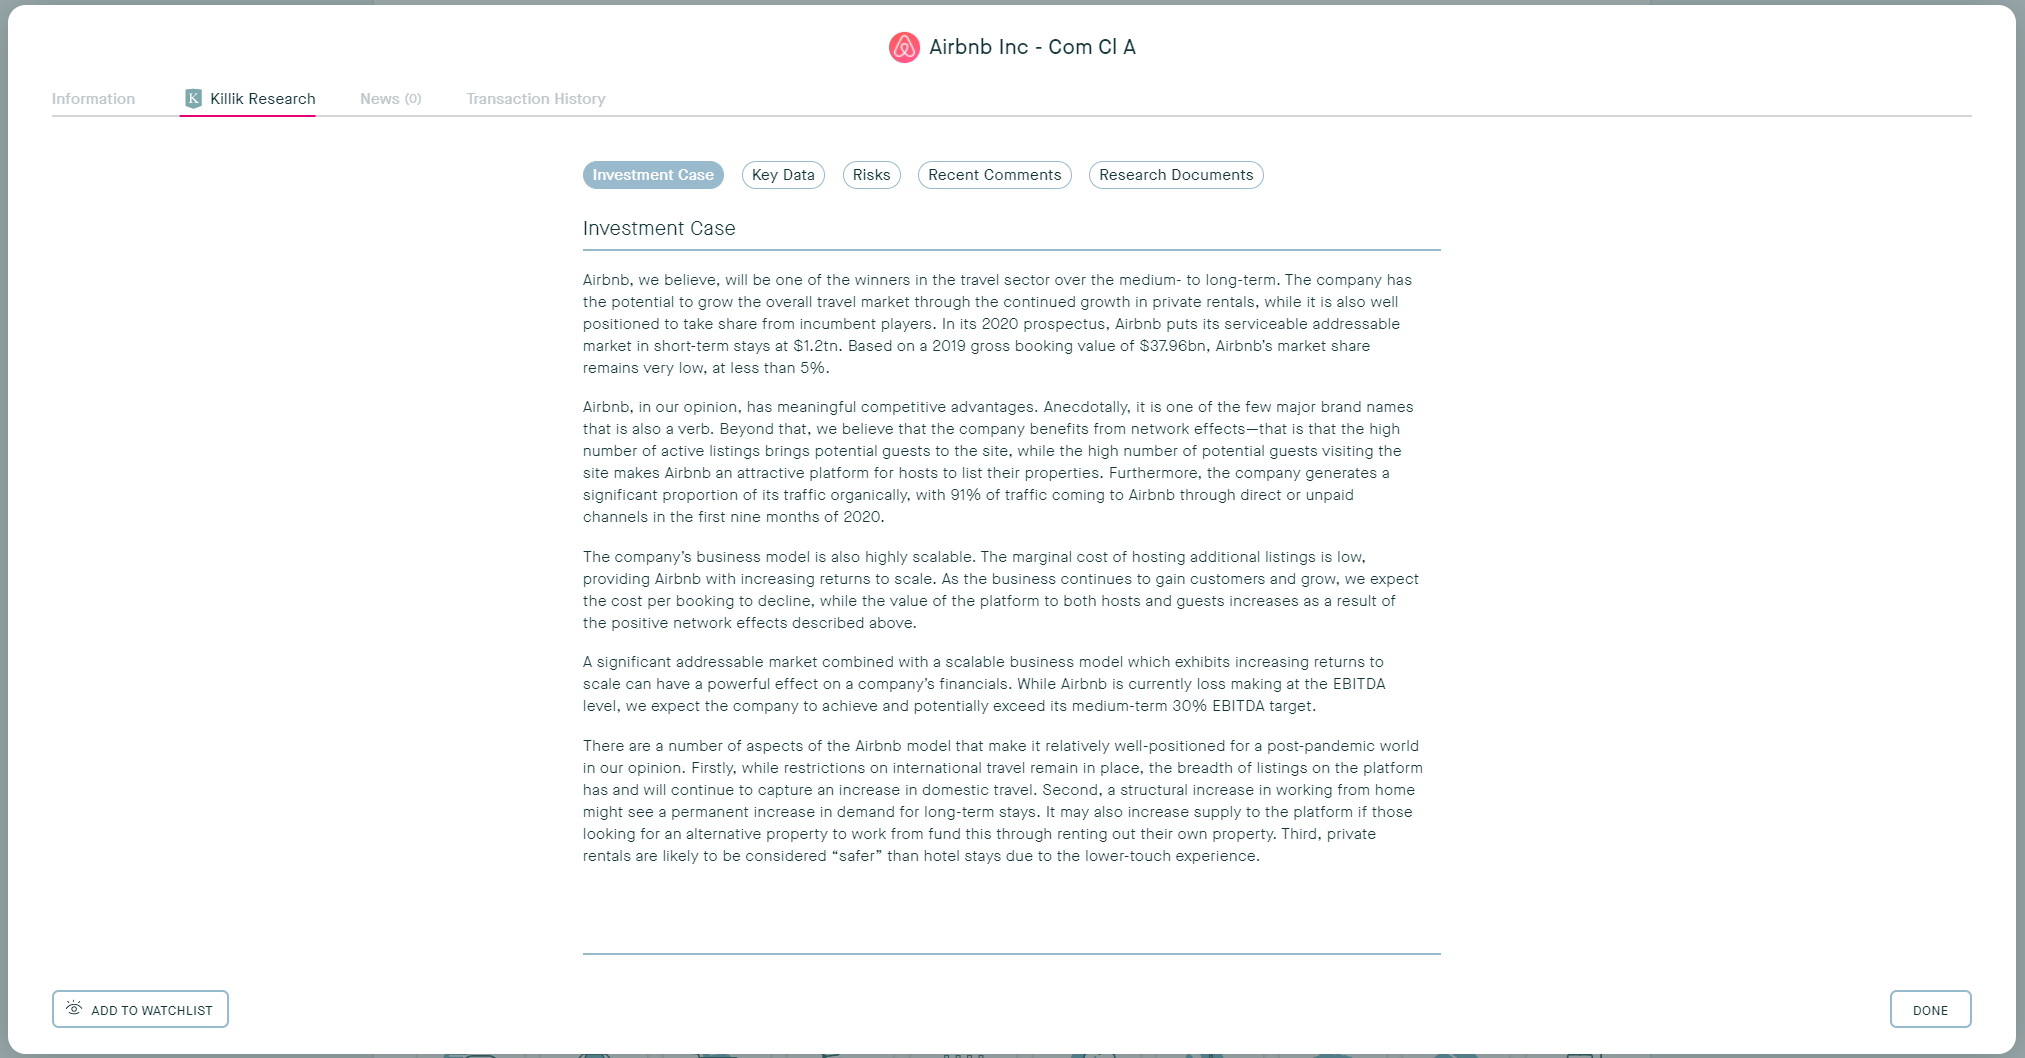
Once you have clicked into a stock, we have also updated the stock card to display the following tabs:
- Information, Killik Research, News, and if applicable, Transaction History.
These options have been added to both Equities and Funds, making it easy for you to see all of the information available, without clicking out of the card.
Information now includes the performance graph, as well as the sector it belongs to and our classification of the stock, under which you can find some brief background information.

Clicking into Killik Research will give you a full overview of the stock, including the Investment Case, Key Data, Risks, Recent Comments, and Research Documents.
If there has been any recent news for the stock you are viewing you can read it easily from the News tab, and finally, if you are viewing a stock you hold you can quickly see your Transaction history too.
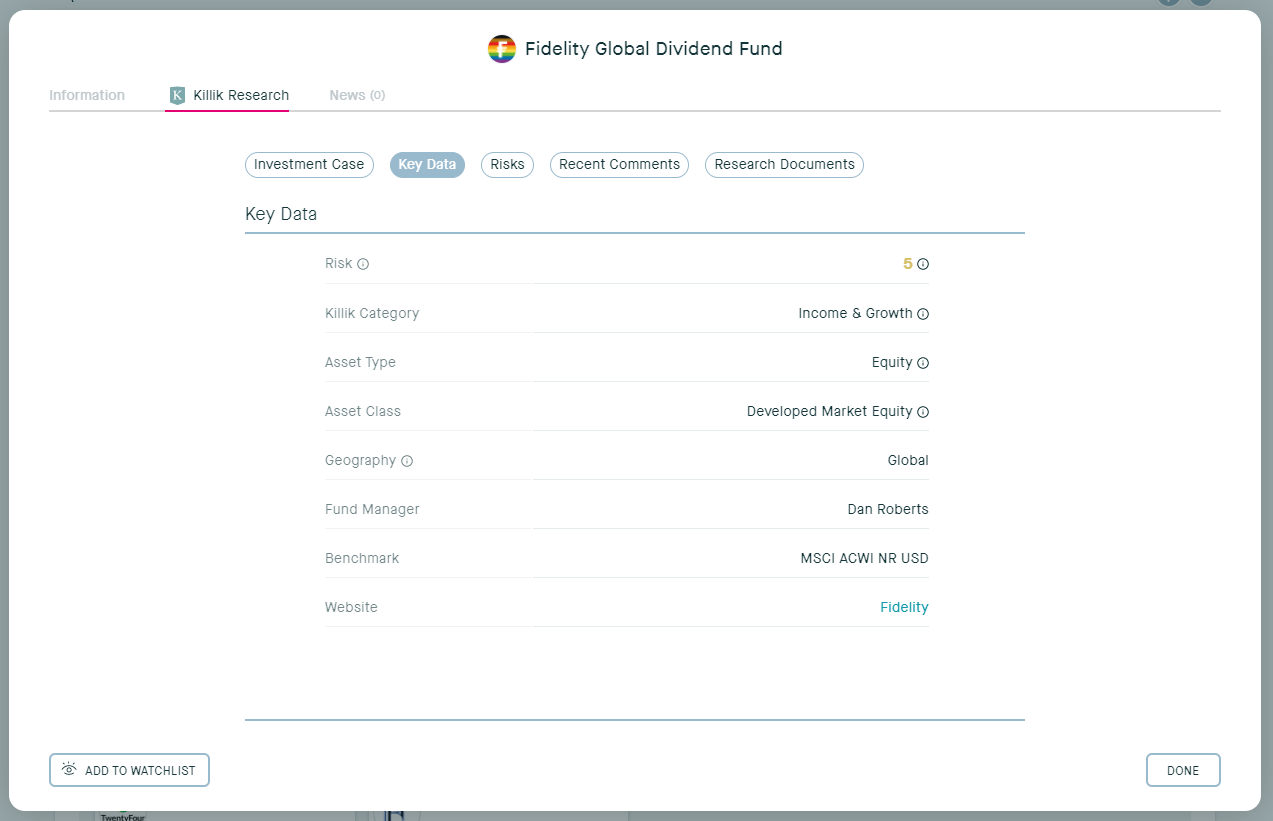
Where the stock cards have been updated, funds have had a revamp in the Key Data section. There are now the following new categories: Risk, Killik Category, Asset Type, Asset Class, Geography, Fund Manager, Benchmark, and Website.
Investments page and Watchlists page:
The investments page and Watchlists page has also been updated with the same stock cards, so now when you click into any of your investments you can see an overview of the information we hold, Killik Research (if available), News, and your Transaction History (if available).
The same information will pop up when viewing anything you have added to a Watchlist, making it even easier for you to decide on investing or not.
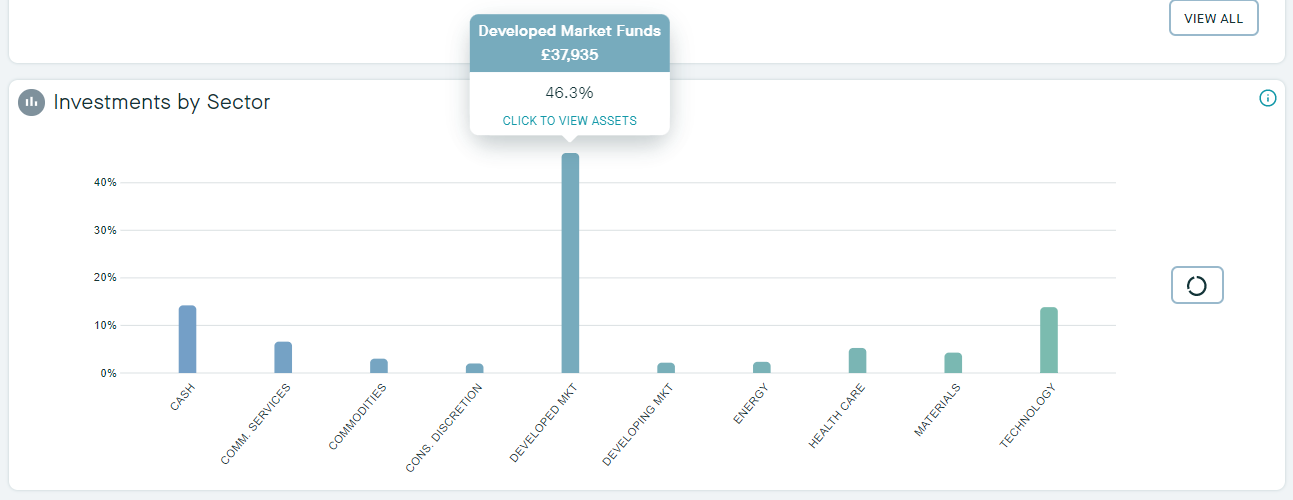
Advised View: Investments by Sector
We have also updated the Investments by Sector section in the Advised View of the Dashboard. Now when you hover over a bar you have the option to view the assets that make up the category.
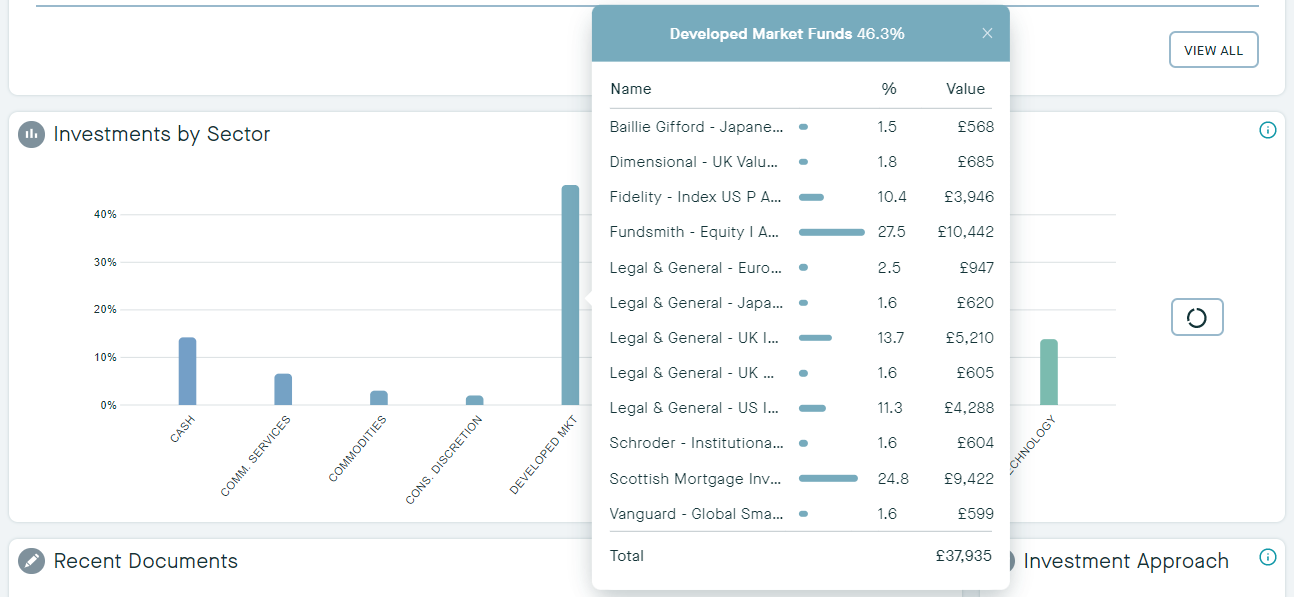
Clicking the bar will bring up a breakdown of the assets within the category, plus the percentage they make up, and the monetary value.
You can further drill down by clicking on the equity or fund to display our new stock card for further information.
European Pricing Graphs:
Finally, we have updated our pricing graph coverage to now include pricing graphs for European equities.
Disclaimer: please note that Research may not be available on myKillik for all clients. If you are unable to view research within your myKillik account, it is likely restricted due to regulatory provisions.