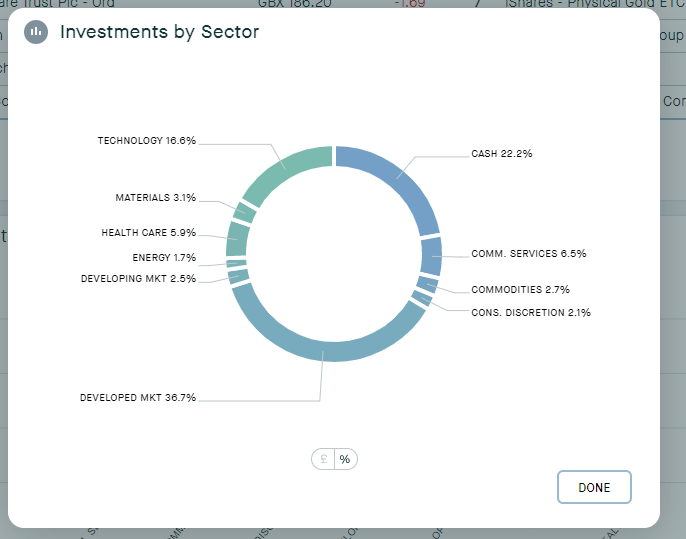
Investments by Sector
We’re pleased to announce that due to popular demand we now include a Sectors chart within the “Advised View” for the dashboard. This provides a visual representation of the sectors spread across your portfolio and is fully responsive to your filter selections.
To add in sector analysis, you can complete the following:
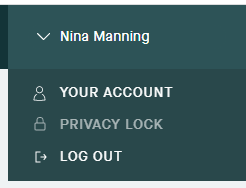
1. Click on your Name in the top right hand corner and go to 'Your Account'
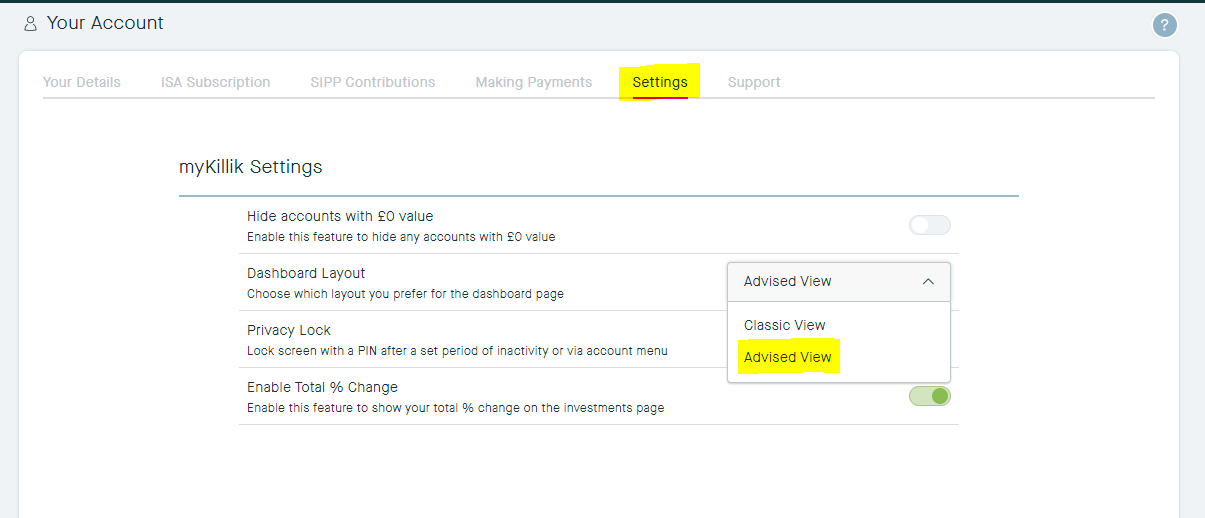
2. Click on Settings and select the drop down Dashboard Layout > Advised View
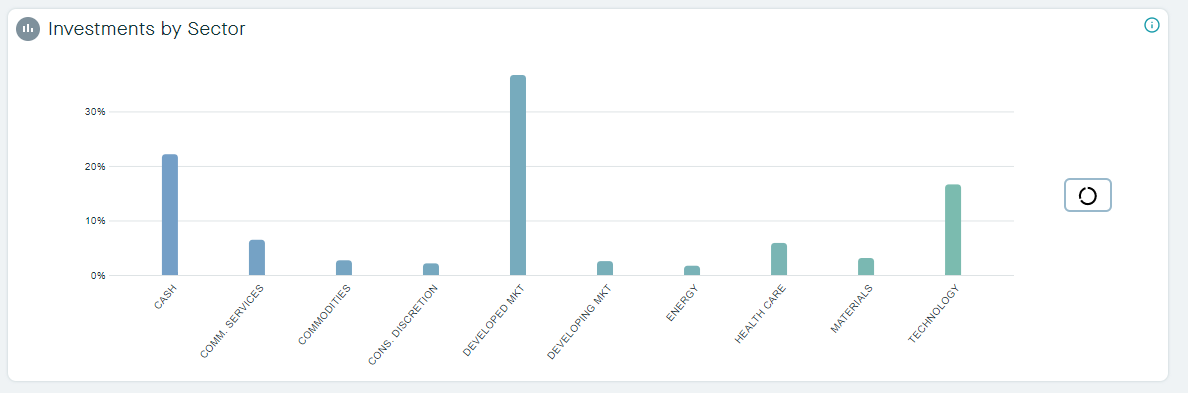
3. Navigate back to the Dashboard and you will see 'Investments by Sector' displaying
How to use this feature
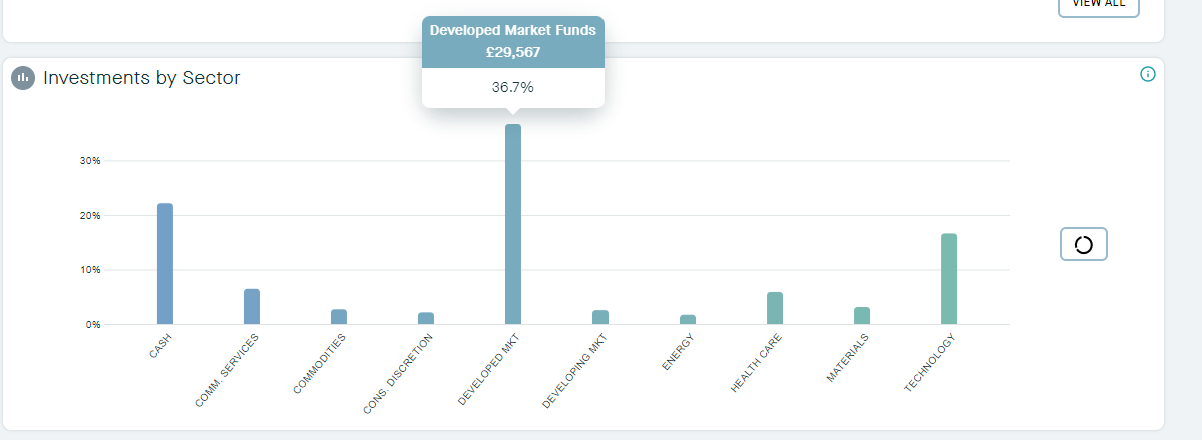
Hover or Click on a bar to see the £ and % value of your Investments by Sector.
Click on the Pie Chart button to view the £ and % value of your Investments by Sector. You can use the £ / % toggle button to do this.
Filters and Sectors
You can use your Dashboard Filters: Accounts, Services, Wrappers to view your Investments by Sector too.
Still to come...
We will add in the ability to have a quick view of your investments (inclusive list) by sector. At the moment to view a sector against an investment you can do this by:
1. Going to the Investments Page
2. Clicking on an Investment
3. Looking at 'Sector' information
Killik provides Thematic information on covered equities which is also useful.
Other Changes
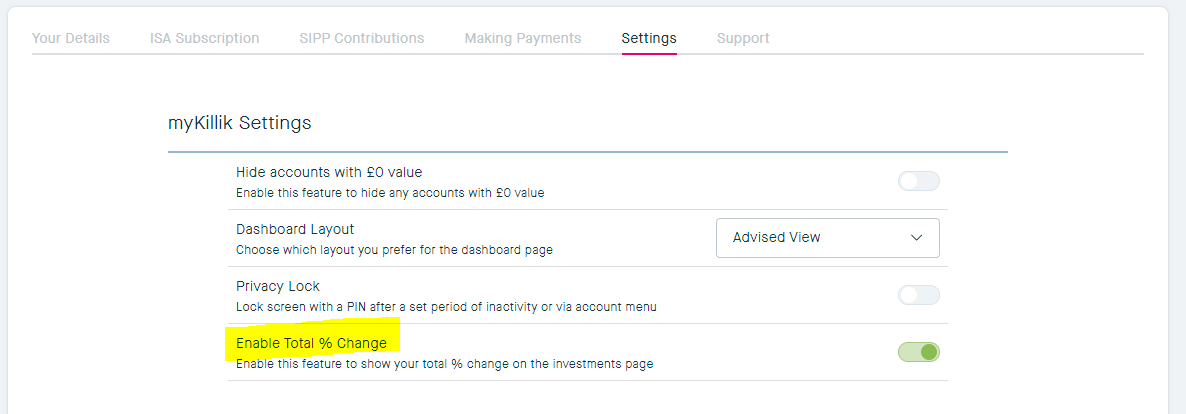
Add % Total Change in Settings
If you would like to see % Change as a total displayed on your Investments page you can do this by switching this feature on in Settings:
Small changes
- Improvements to date selection across myKillik
- Added date formatting capability to exports